Introduction
What’s up, Spike Week fam? We’re deep into NFL drafting season, with daily contests filling up fast and Best Ball Resurrection now live, but the Double Dribble tournament is flying under the radar as a source for potential +EV drafting. Last year, I dabbled in Double Dribble because it looked like it might overlay—and it did—but I was drafting blind with no historical data to guide me. Luckily, Underdog has provided last season’s tournament data, and I’m here to break it down for you as we are on the path to overlay once again.
Tournament Basics
In the Double Dribble tournament, your roster consists of 16 players. Each week, you need to field 2 Guards, 2 Wings, 1 Big, and 1 Flex and all other scores being unused. Scoring includes both offensive stats (points, assists, turnovers) and defensive contributions (rebounds, steals, blocks).
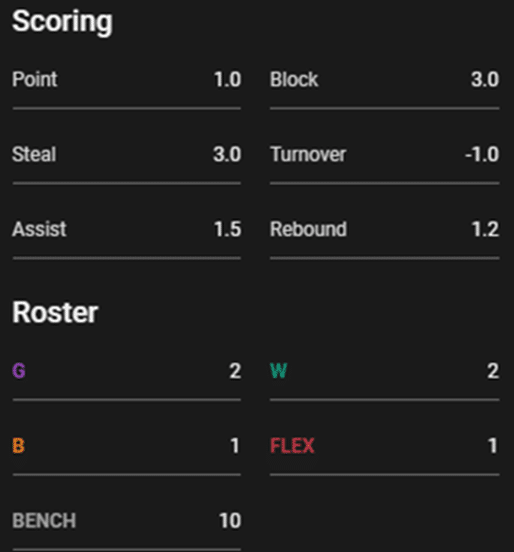
This year’s tournament has a unique structure. Unlike last season, where most of the prize pool was awarded based on regular season cumulative scores followed by traditional best ball playoff advancement, this year’s format features a regular 2/12 “regular season” format followed by a postseason sprint.

To determine what the field has been doing and what has worked, I unfortunately only have last season’s Double Dribble tournament. Despite structural differences between seasons, the core 2/12 advancement format and scoring remains unchanged, allowing us to draw some valuable insights.
Scoring & Advance Rates
To kick off the analysis let’s start with a basic, ADP x Best Ball Scoring to see how positions score and maybe visualize some tiers.
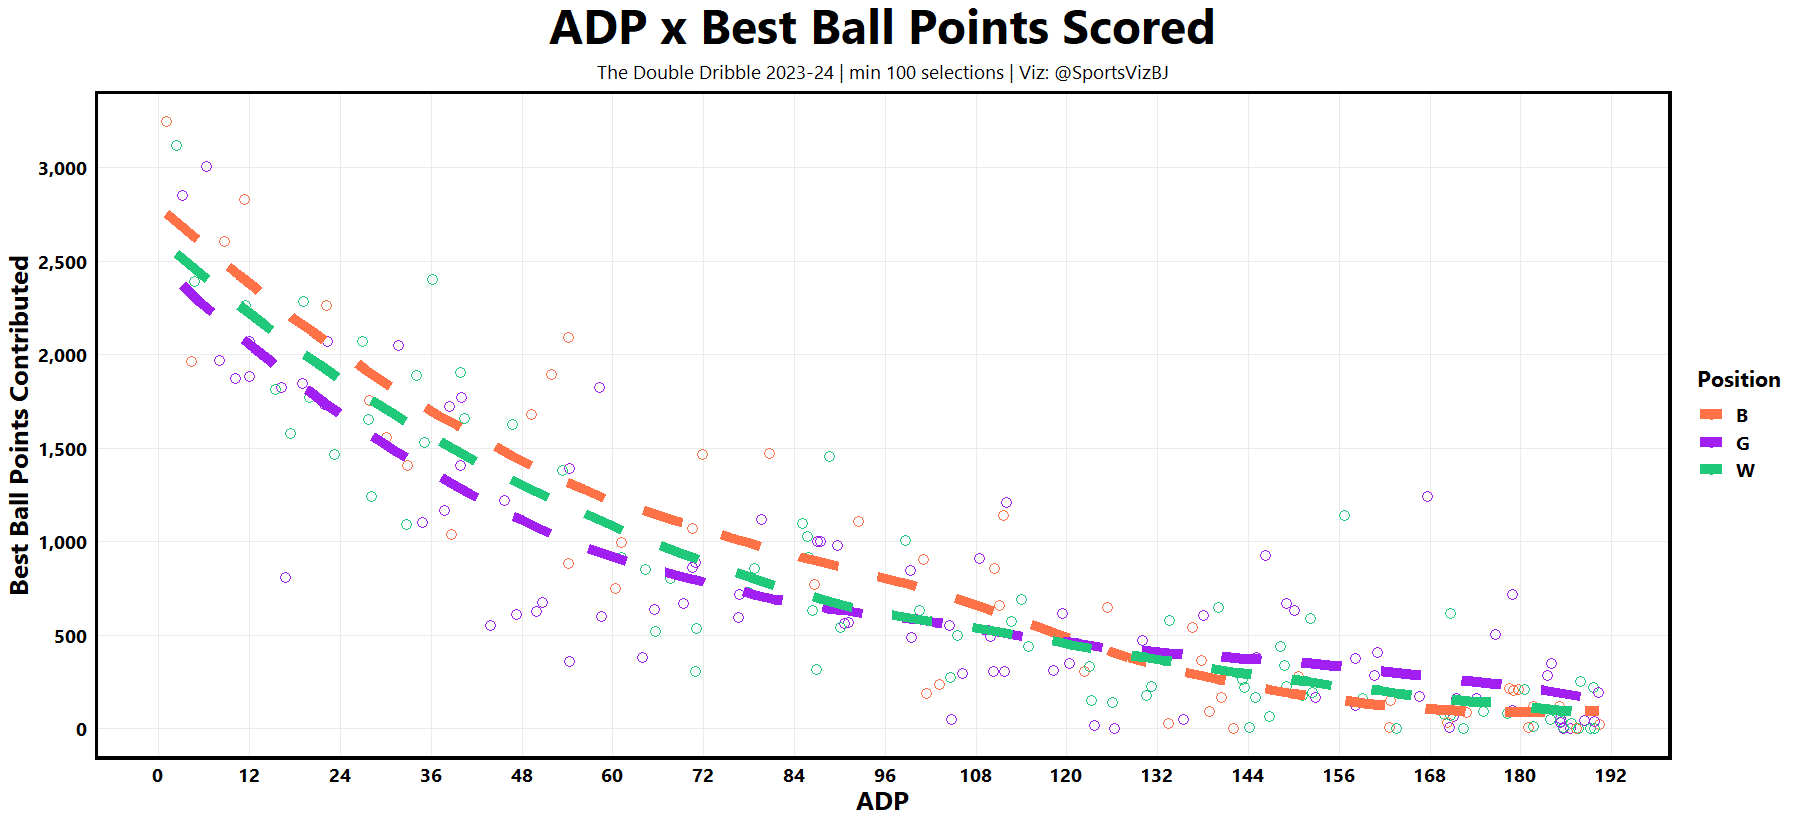
Analysis:
- Guards: Guards were the lowest scoring position in the early and mid-rounds but started to outpace the other positions at the end of the draft as the production line got quite flat towards the mid and late rounds.
- Bigs: Bigs dominated scoring in the early and middle rounds but saw a significant drop-off in the later rounds.
- Wings: Wings were the steady middle scorers at all points of the draft.
Next, I wanted to plot player level advance rate to put context to the summary visuals that are presented subsequently.
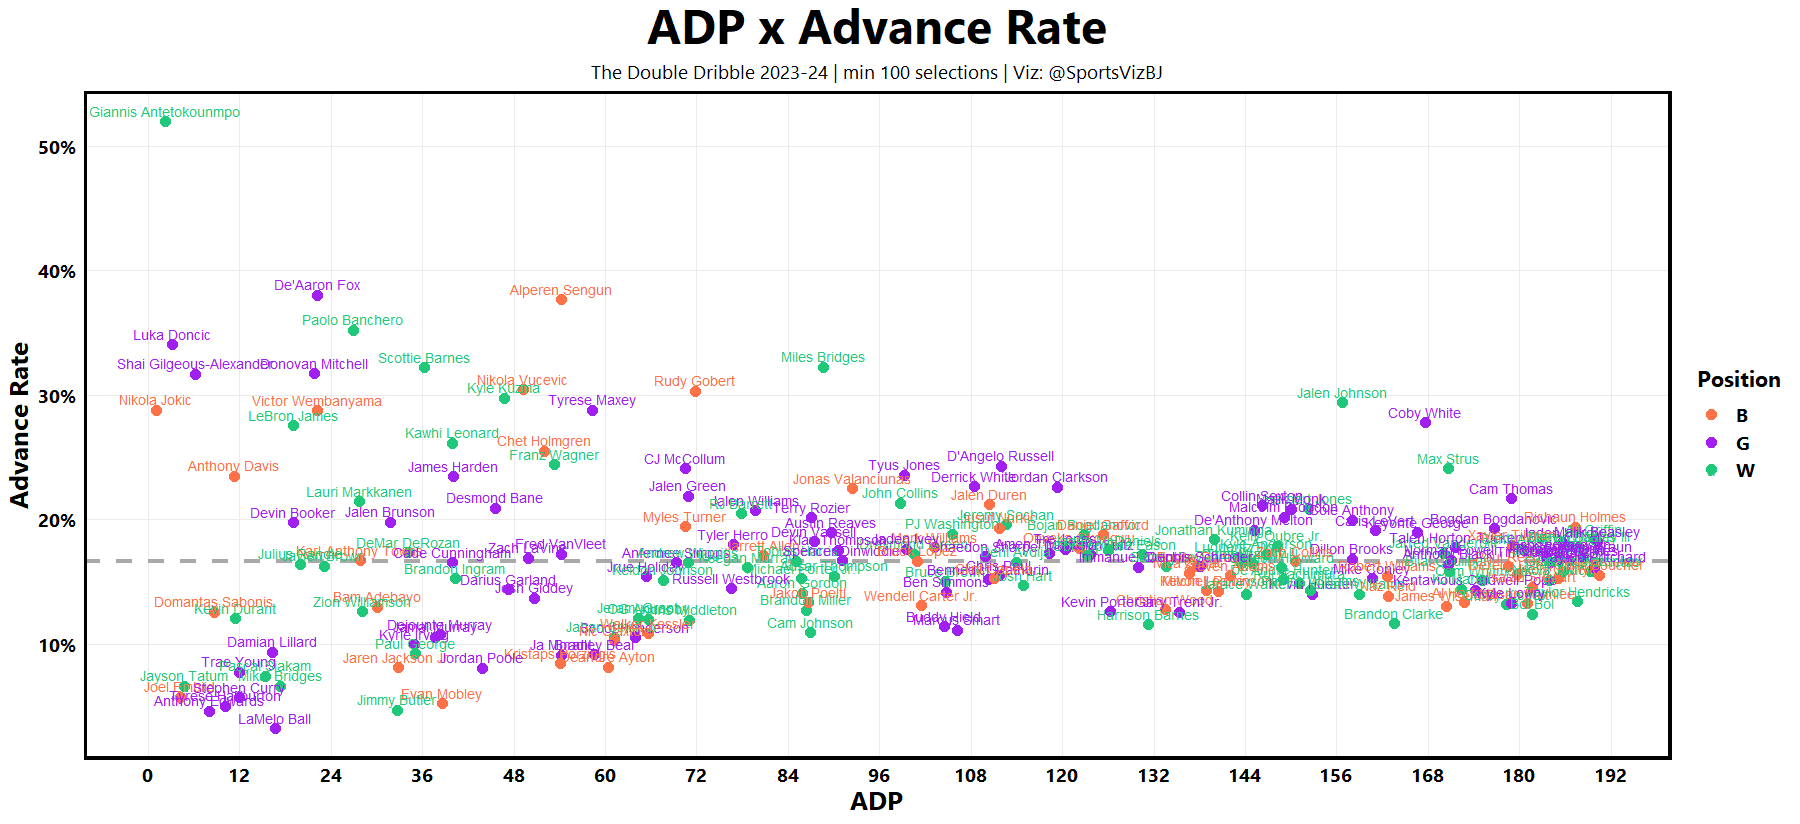
Analysis: There were heater picks at all points of the draft, e.g., Jalen Johnson and Coby White, but the biggest difference makers came in the top 7-8 rounds.
Team Structure
Team structure is essential when drafting any best ball team to ensure the team isn’t completely toast upon ending the draft. Here, we identify basic guidelines to keep our teams on track so we can capitalize on drafting the right players.
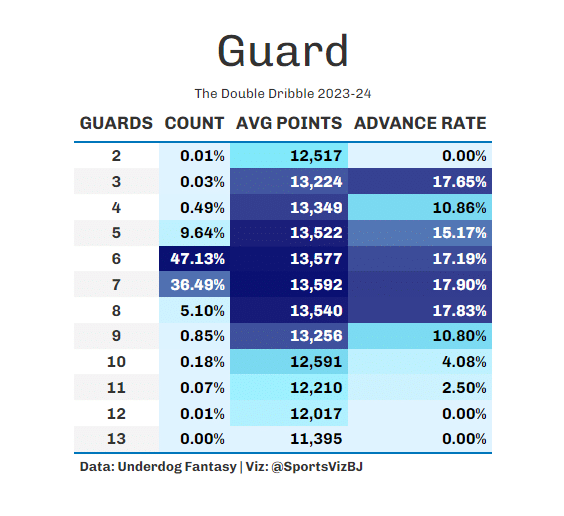
Common Builds: The field was highly concentrated around six and seven guard builds, followed by five and eight guard builds.
Optimal Strategy: The best advance rates were seven and eight guard builds, with just under 18% advance rates.
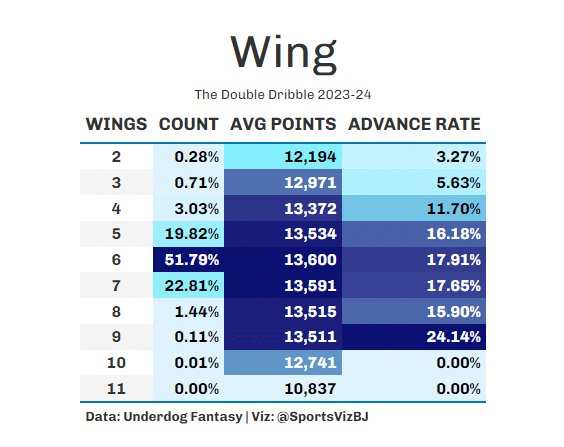
Common Builds: The field was highly concentrated around six wing builds, followed by five and seven wing builds.
Optimal Strategy: The best advance rates were six and seven wing builds, with advance rates north of 17.5%.
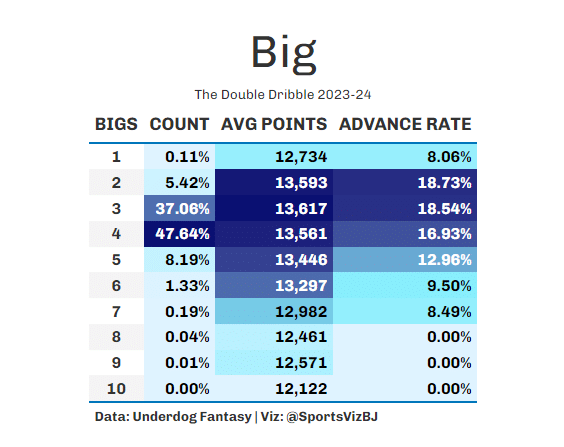
Common Builds: The field was highly concentrated around three and four big builds, followed by two and five big builds.
Optimal Strategy: The best advance rates were two and three big builds, with advance rates above 18.5%.
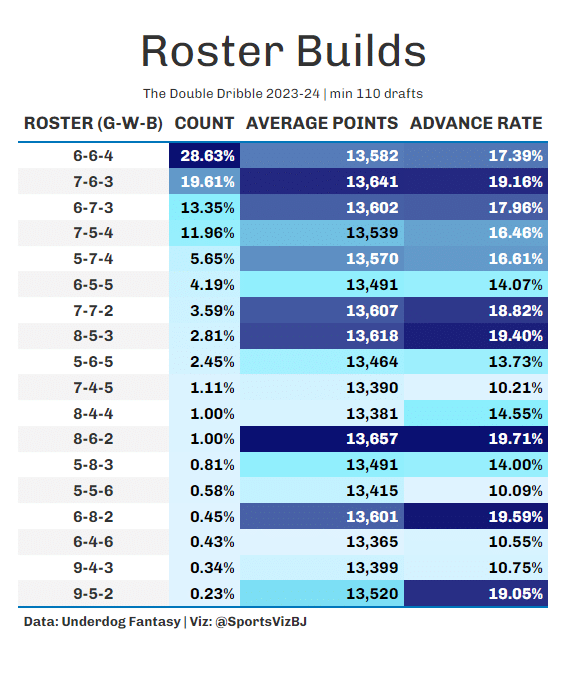
Summary of Roster Builds: Combine all the above and the most common builds were 6-6-4, 7-6-3, 6-7-3, and 7-5-4, making up roughly 73.5% of the field. Of this group, the 7-6-3 structure performed the best, with an amazing 19.16% advance rate where the 7-5-4 was the worst with a 16.46% advance rate. Outside of these chalky builds, there is evidence that getting a little unique through structure could work as many of the less used builds popped up as having 19+% advance rates, especially with only two big rosters.
Early Round Structure
The problem with summary data is it’s muddied with people who took different paths to drafting. Some three big teams drafted theirs early while others prioritized other positions with those picks. Not all builds are made equal, how you get there matters. Additionally, if a majority of the field is concentrated around the base builds, we must look for a new angle to attack. This section will look at how teams built their teams in the key rounds of the draft (first half) and the effectiveness of those starts.
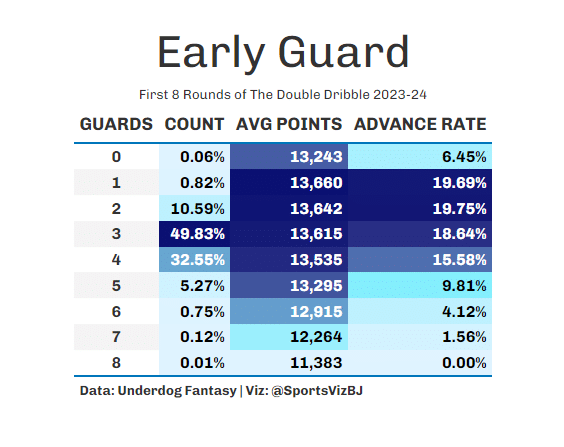
Common Builds: The field was heavily concentrated around three and four guard starts.
Optimal Strategy: Three guard starts fared very well, but the best advance rates were found by one and two start guard starts and teams that went four guards were very behind the 8-ball. Directionally, it is quite clear that investing less at guard was beneficial.
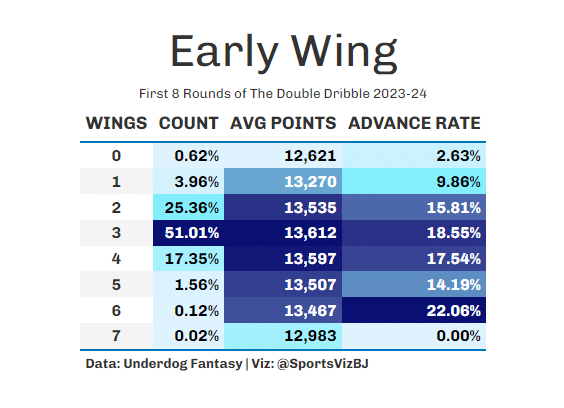
Common Builds: The field was heavily concentrated around three wing starts, followed by two and four wing starts.
Optimal Strategy: The three wing start fared the best (excluding small sample six wing builds) followed by four wing starts. Over or under investing at wing early was problematic.
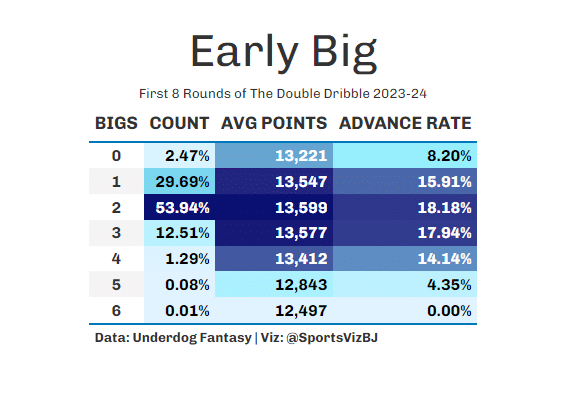
Common Builds: The field was heavily concentrated around two big starts, followed by one and three big starts.
Optimal Strategy: The most common start of two big starts performed the best, but the second most common start of one big was quite a bit worse than the three big starts. More, not less, investment in big, within structure, was better which feels a bit counterintuitive for a position which you only start one plus maybe a flex position. This is probably one of the more interesting takeaways I came across.
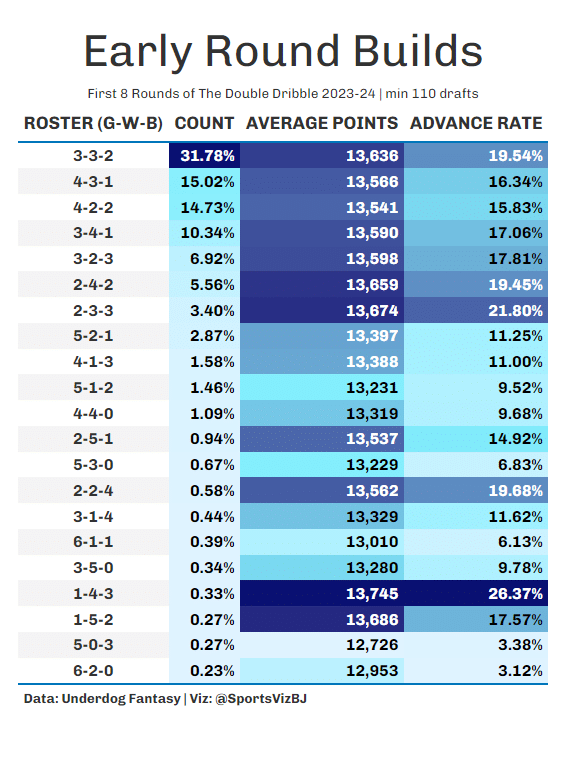
Summary of Early Roster Builds: Combine all the above and the most common build was 3-3-2, making up roughly 32% of the field. This structure performed one of the best in the tournament, but the next most common structures in the tournament did not. The standout data point is the small sample standout of 1-4-3. Anchor guard, bully big, while staying on structure at wing has a logical theoretical backing which leads me to believe this could be more than just a small sample anomaly but has some signal as to what could be optimal.
Conclusion
I hope you found these data points insightful. The edges in non-football competitions can be substantial, and now you’re equipped to mix in some NBA drafts. Please note this is only 1 year of data in a slightly different tournament environment, so please consider these differences and the player level performances that drove the summary statistics when designing your strategy for this year. Stay tuned for more Double Dribble and other best ball content soon!


