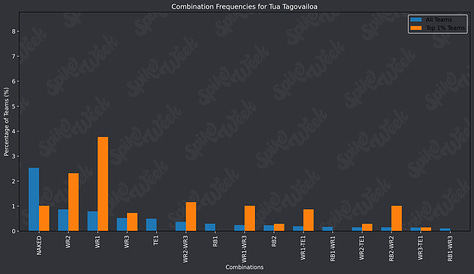
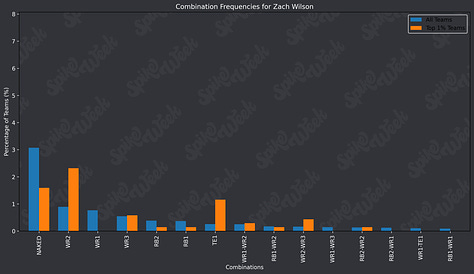
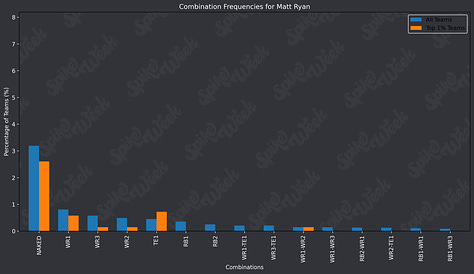
At the time of writing this article there are 21 days until the NFL season kicks off and best ball tournaments lock. Drafter’s flagship $20 Million II NFL Best Ball tournament is currently only 30.25% full. The tournament is currently filling at a rate of approximately 1% per day over the past week, which you can see using our Tournament Fill Rates tool.

If the tournament continues to fill at the current rate, it will wind up with just under 50% overlay. I fully expect the sickos to come out in force and pump up that fill rate, but I still expect substantial overlay. If you’re new to best ball you might be wondering “Why do I care about overlay?”. Simply put, overlay is free money that the operator is injecting into the tournament prize pool, above and beyond the entry fees paid by the users. If the overlay is larger than the rake (Drafters rake on this tournament is just over 10.1%) then you are effectively being paid to play in the tournament assuming you are a drafter that has no advantage or disadvantage when compared to the field. I know for many of you reading this article, the purpose of playing best ball is to profit. If I told you there was a tournament where by simply being an average drafter gave you an expected ROI of 20%, would you be interested? That’s potentially what we’re looking at here with Drafters.
I wanted to write a comprehensive guide for crushing Drafters, in typical Sackreligious fashion with a deep data dive, modeling, the whole 9 yards. I’m going to be blunt:
I’ve got tons of my own drafts I need to get done, and I’m sure you do as well. If I spent the time I wanted to on this article it wouldn’t be ready in time for you to properly take advantage of the opportunity on Drafters. While I always want to provide the highest quality analysis that I can, I also need to recognize that perfect is the enemy of good enough. In this circumstance with such an incredible opportunity for overlay, we’re going to focus on just one aspect of our strategy on Drafters. The goal is for you the reader to be able to go to Drafters armed with the knowledge in this article as well as Erik Beimfohr’s Drafters strategy article and be at least an average drafter. I have full confidence that many of you reading this are well above average drafters and would have a positive expected ROI regardless of the overlay. But in a tournament with this much potential overlay, even an average drafter can have an expected ROI well into the double digits.
In this article we’re going to examine the results from the Drafters Million tournament last season. We’re specifically focusing on the rates at which the field stacked individual quarterbacks, how they did it, and the differences between the top 1% of teams and the field. I’m going to preface this with the caveat that this is analysis based on historical results and it does not mean that simply copying and pasting what worked last year will work this year. The way I personally try to benefit from analyzing descriptive data is to apply nuance and think critically about how I can best translate this information to the current draft meta.
I enjoy playing games competitively; poker, board games, strategy based video games all have meta games. Some games like poker and chess have effectively been solved with modern computing, and it is possible to play those games with a game theory optimal strategy. For unsolved games, the meta often evolves as new dominant strategies emerge. My biggest advantage in playing games has always been assessing changes in the meta and their implications faster than my opponents. In all the games I’ve played competitively I’ve never been the best in the world, or been ranked #1 for an extended period of time. I have frequently been a dominant player when the meta shifts. I guess I wrote all that to tell you that I have a knack for picking out stuff that the field might be slow to catch on to, but then I watch my edge diminish and I turn back into a pumpkin as the better players pass me by when they become acquainted with the new meta. So without further ado, let’s take a look at a potential meta change with respect to stacking on Drafters.
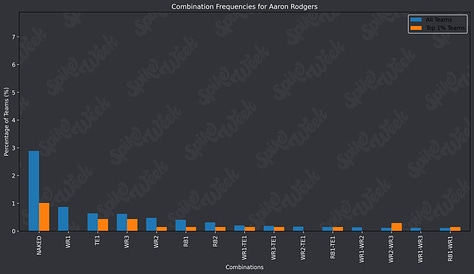
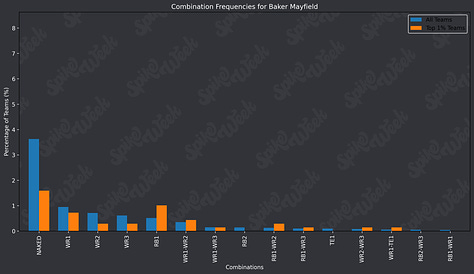
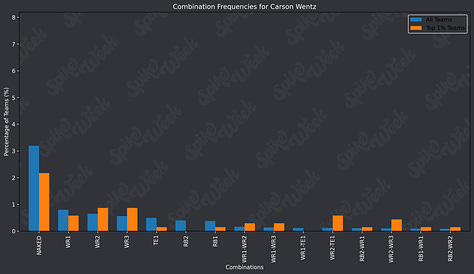
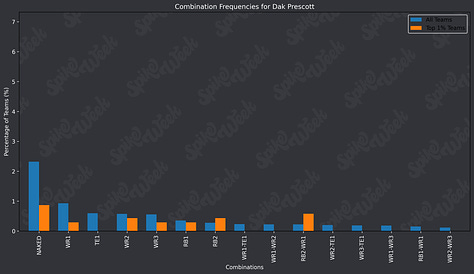
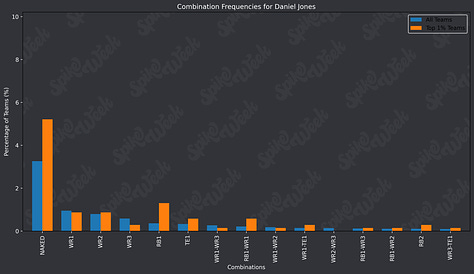
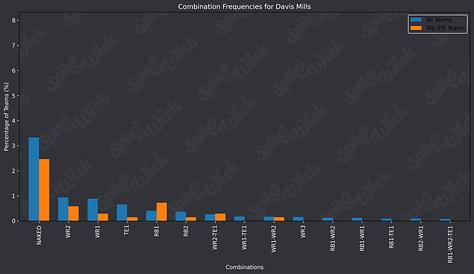
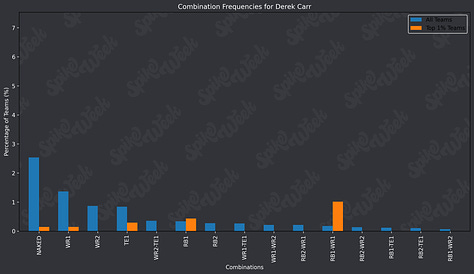
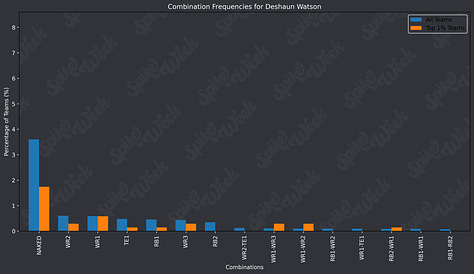
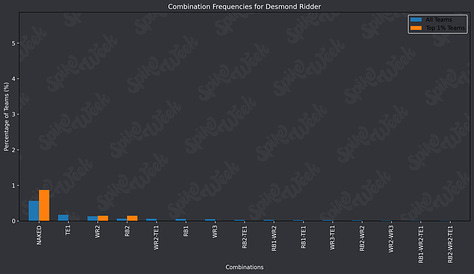
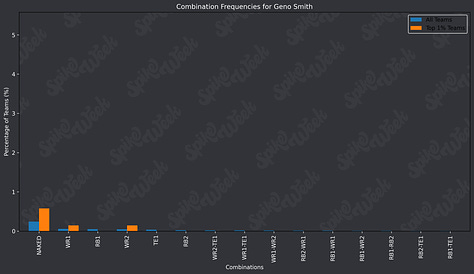
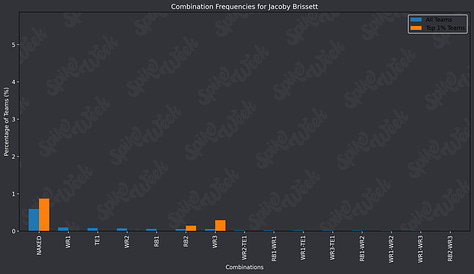
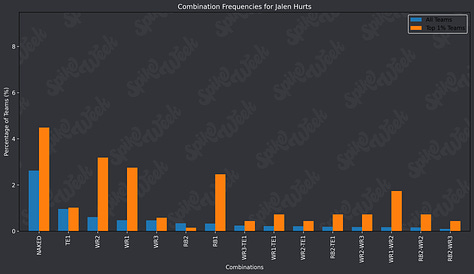
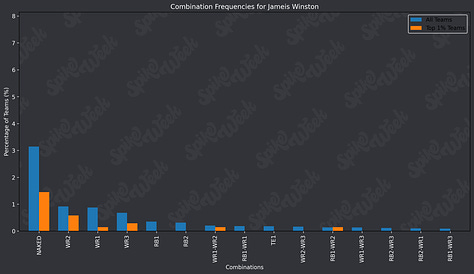
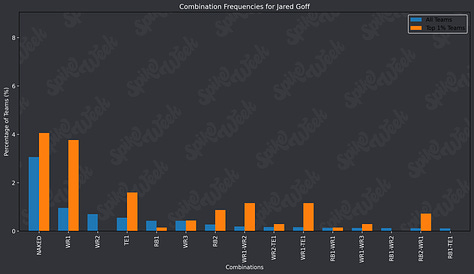
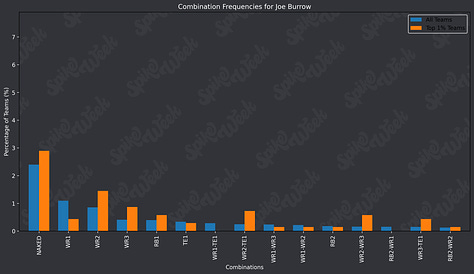
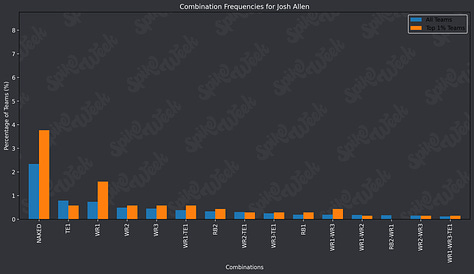
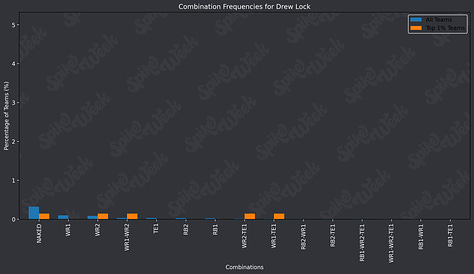
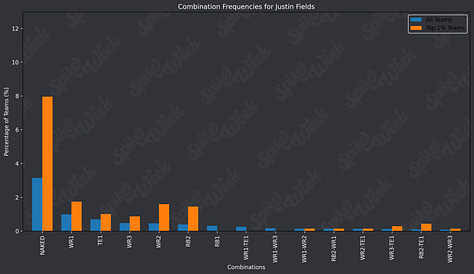
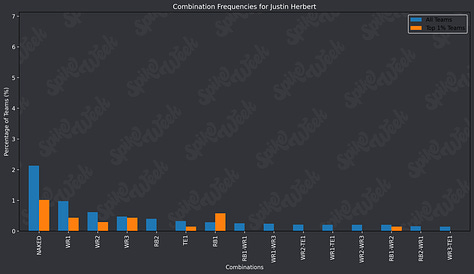
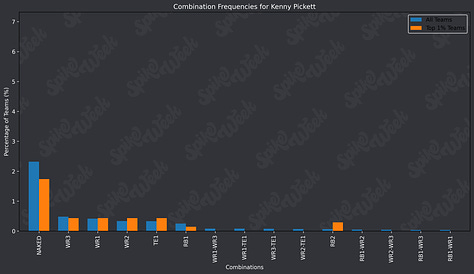
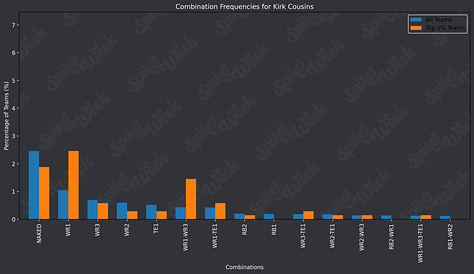
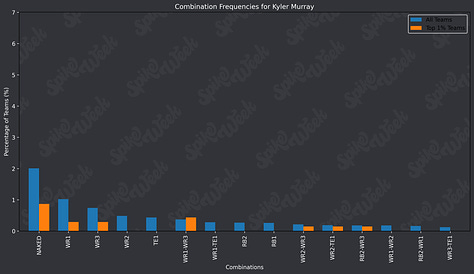
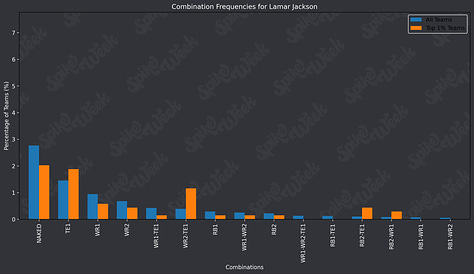
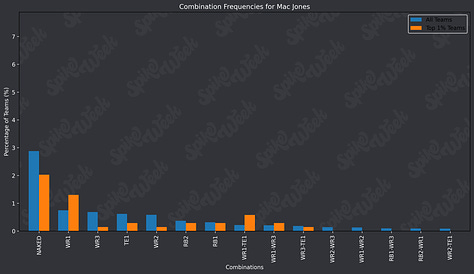
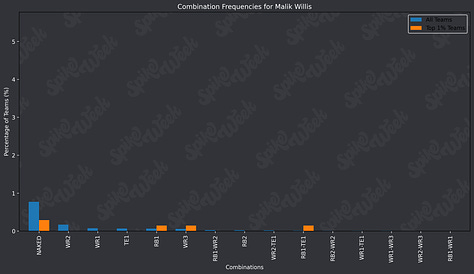
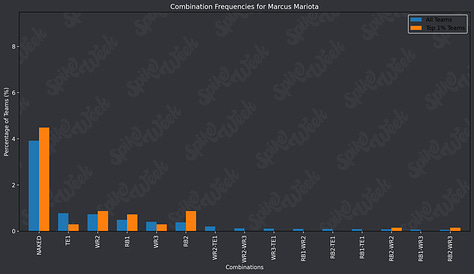
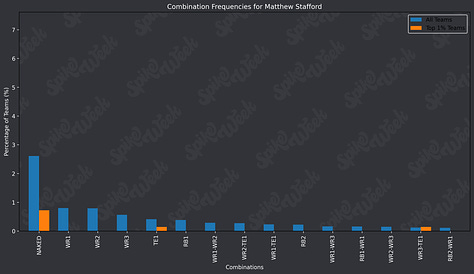
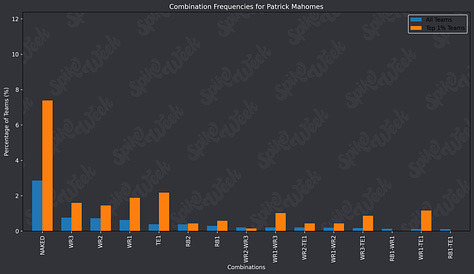
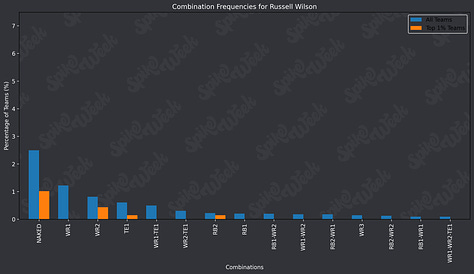
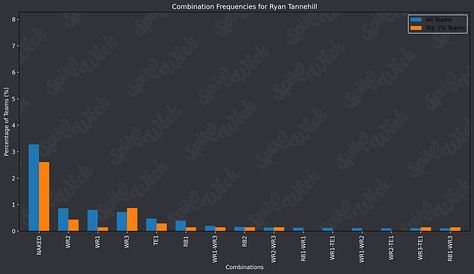
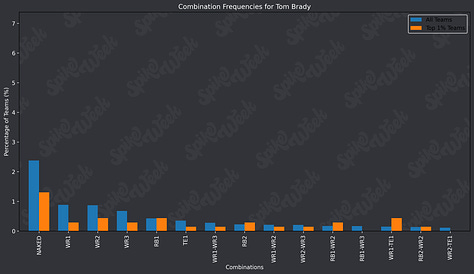
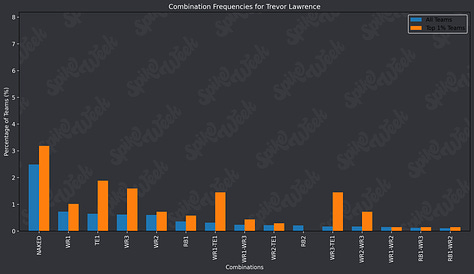
For this analysis, I wanted to focus on what the field did at the highest frequencies, what appeared in the top 1% of teams at the highest frequencies, and lastly what appeared in the top 1% at the highest relative frequency based on how often that specific stacking combination was utilized by the field. At the end of this article I’m going to provide a chart dump of the top 15 stacking combinations utilized most frequently by the field for each QB. You can comb through this data like I did and come to your own conclusions.
We’re going to start with some summary charts. This first chart shows the raw difference between top 1% scoring teams and the field for specific QB stacking combos. To give a simple explanation, Justin Fields was drafted naked approximately 3% of the time by the field (when we consider that only 8.33% of teams were able to draft Justin Fields, that comes out to a staggering 36% of Fields teams drafting him naked). Naked Justin Fields teams appeared in the top 1% scoring teams at approximately 8%. 8% – 3% = 5%. That’s the math behind this chart. Super simple.
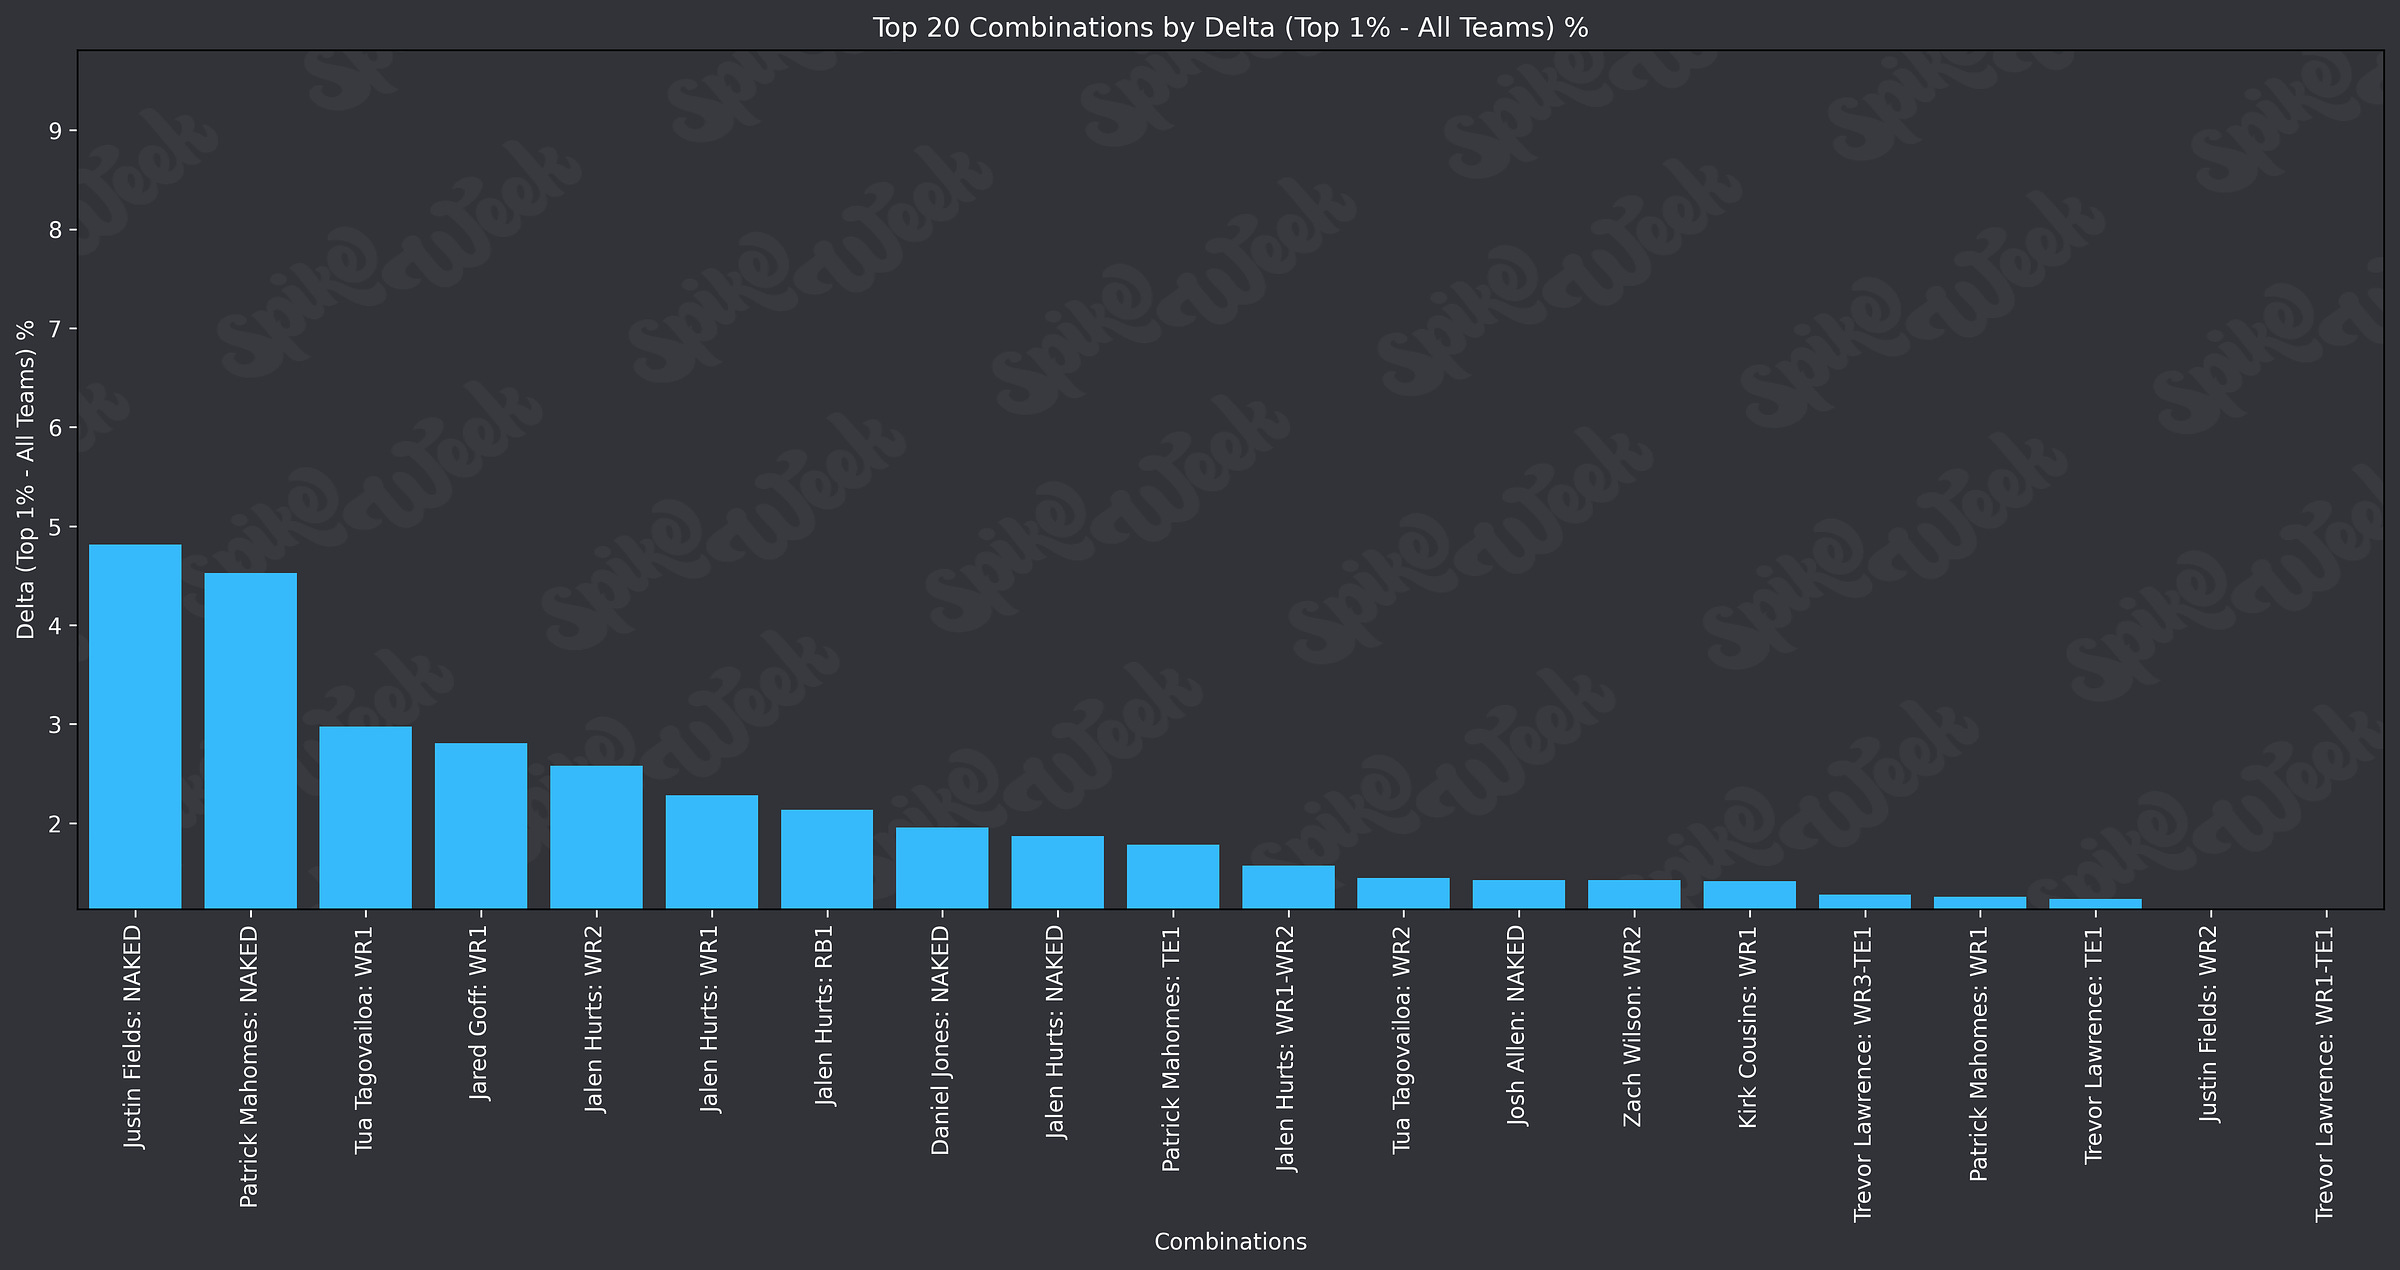
So what is going on here? The top 2 QB stacking combos when looking at the raw delta between top 1% teams and the field are naked Justin Fields and naked Patrick Mahomes! “That doesn’t make sense, I was told stacking is important!” You may be thinking to yourself. Well hold on dear reader, I won’t make you languish in stacking limbo for too long (I have way too many teams to draft to do that).
Here’s a chart that shows the relative difference for QB combos that occurred in the top 1% compared to the frequency the field was drafting that combination at.
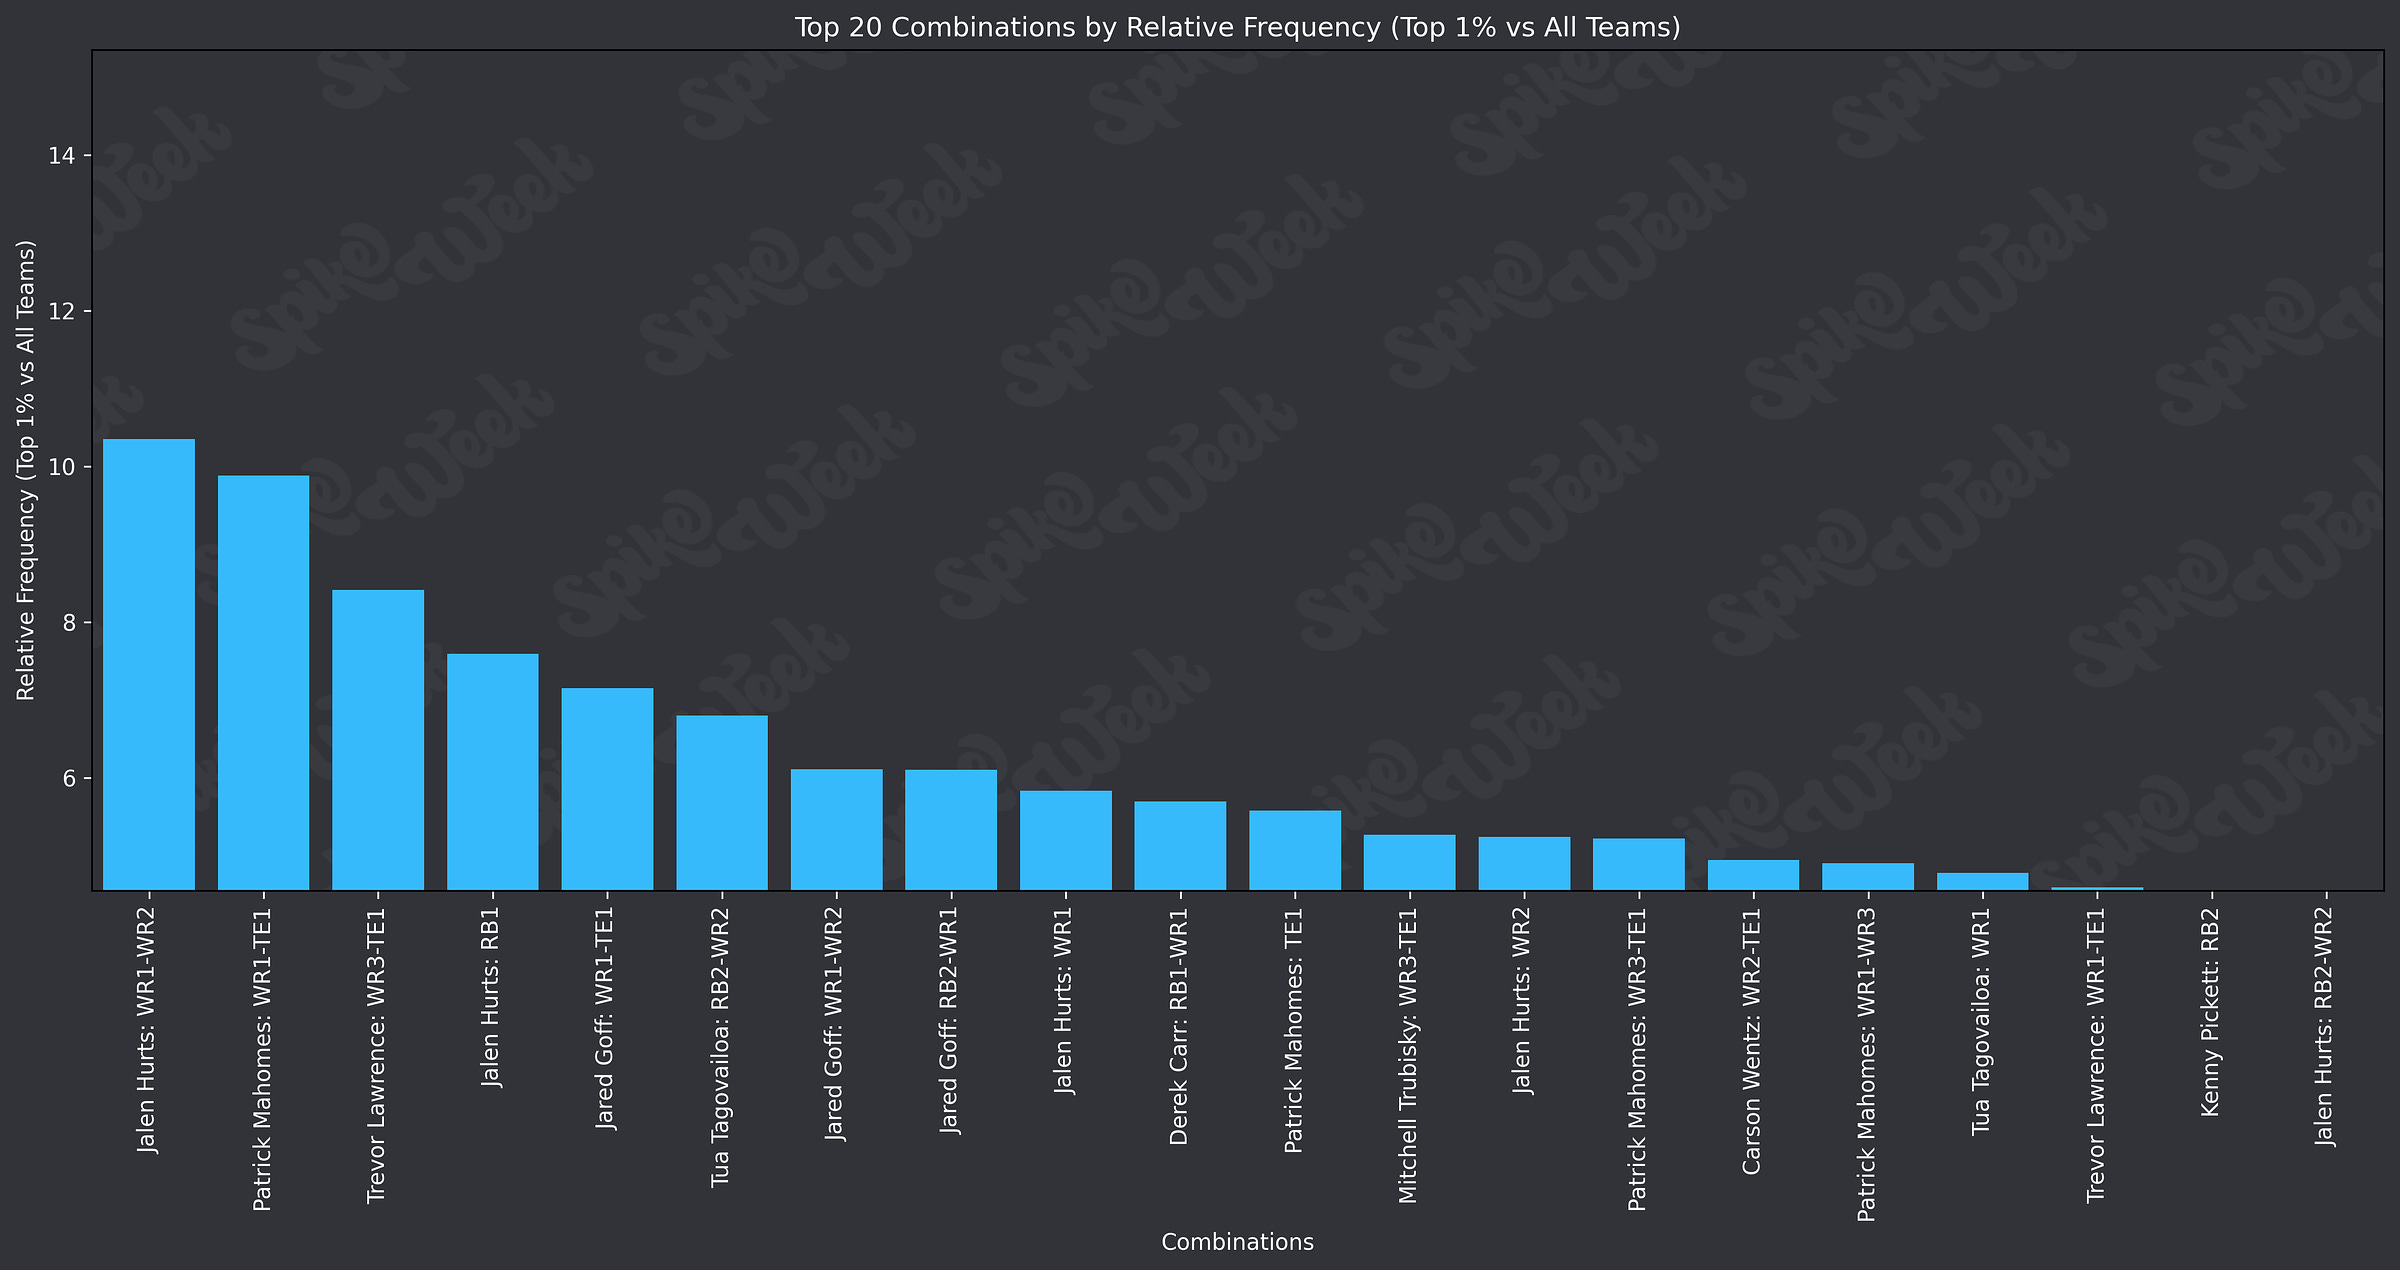
This chart shows us that Jalen Hurts stacked with his WR1 and WR2 occurred in the top 1% of teams over 10 TIMES the frequency we would expect it to based on the base rate it was being drafted at. In fact, we don’t see ANY naked QBs occur in the top 20 stacking combinations by relative frequency. So what does that mean for us?
The field is not stacking their QBs enough. What the first chart shows us is that if you hit on a QB that wasn’t efficiently priced, you can absolutely get into the top 1% of teams without having him stacked. But the advantage you’re gaining pales in comparison to the teams that actually had that QB stacked.
Wow Sack, you really wrote this article to tell me “stacking good”? Sure, that’s part of it. Let’s look a little closer at how some of the best performing combinations were stacked though. Trevor Lawrence with Zay Jones and Evan Engram, Jalen Hurts with AJ Brown and Devonta Smith, Jalen Hurts with Miles Sanders, Tua Tagovailoa with Jaylen Waddle and Raheem Mostert, Derek Carr with Davante Adams and Josh Jacobs. What do all of those combinations have in common? They hit on at least one of the most mispriced pieces in each of those offenses. When considering your stacking partners in a format like Drafters, where you need to get very close to hitting the nuts to actually take down the tournament, giving yourself room to run on your stacking partners is hugely beneficial. I’m not saying “don’t stack your QB with their expensive pieces”, just that the advantage you gain from being right on an early pick in this format is substantially less than what you gain from finding a guy who is severely mispriced. Be willing to take some shots on stacking partners you may feel less confident in.
As promised, here are the charts for individual QB stacking combos. I tried to distill my conclusions with the above summary, but there can be valuable nuggets to grab from these charts if you’re interested.


