Spike Week is introducing the newest stat to help better describe how good players actually were for Best Ball in previous years. This stat is completely descriptive, but intends to do a better job of describing how much a player helped a Best Ball team. The most common statistics used are total points scored and points scored per game. While both of these measurements are useful, there are reasons that they don’t tell the whole story for Best Ball versus managed fantasy leagues or daily fantasy sports.
Since Best Ball does not require choosing which players to play in a given week, you will always benefit from a player’s best weeks, while not being hurt by a player’s worst weeks as much as in a game where you have to choose which player’s score to use before the games happen. For this reason, total points and points per game do not always tell which players performed best for Best Ball.
For example, Michael Pittman and Calvin Ridley scored roughly the same amount of half point PPR points in 2023. As they both played every game, they also had roughly the same per game score. Michael Pittman was consistently racking up games that weren’t much higher than what the average score was for the position, while Ridley had 5 or 6 games that his score separated, while mixing in some bad games. If you were playing a season long fantasy league, Ridley would have been very frustrating to start on a weekly basis while Pittman would have been one of your favorite players on your roster. If you were playing DFS cash games, you would smash Pittman into your lineup every week if he were the same price as Calvin Ridley. But this is Best Ball. We’re trying to win big tournaments, and we need outlier weeks with big upside to win. Pittman rarely provided a week that would have helped, while Ridley did so much more often.
We have developed a new statistic called SPIKE SCORE that helps visualize the difference between how well players performed in a previous season. The stat is available for NFL, NBA and MLB (if you’re doing in season drafts, this information can be very helpful to find people whose total points don’t match how often they spike). On the Spike Week player stats page we are showing each players Spike Score, as well as their Points per spike.
Spike Score explained:
Every season the scoring is different, and how much individual players separate from other players at their position determines how important that player is to help you win. We take a certain number of scores at each position for each week of the NFL season and find the average score as well as the standard deviation of the score throughout the season. We do not take every score because in a given week there will be too many players that have a score of 0, and we don’t want this to skew the average too low.
Once we have those numbers, we can calculate each players Spike Score. The score is a cumulative number, so if someone missed half the season, their Spike Score will be much lower than if they had played the entire season. The Spike Score is calculated as like this:
Take each weekly score for the player and subtract it from the mean score for their position. If the value is negative, we throw it out because in Best Ball you don’t have to use player’s bad scores. If the score is positive, we divide it by the standard deviation. All of these numbers are then added together to get a player’s cumulative spike score.
The cumulative Spike Score is simply the sum of a player’s weekly number of standard deviations from the mean score for the position, throwing out any negative scores.
Points per Spike is simply a player’s total points divided by their spike score. For a player like Devon Achane who did not play the full season, he had the fifth best RB Spike Score, but he required the least amount of points by any RB per point of Spike Score. It shouldn’t surprise anyone that listens to Legendary Sickos that the two best players in Points per Spike last year were George Kittle and Devon Achane.
Here is an example of how the score is calculated:
Let’s say the mean WR score is 15 points and the standard deviation is 5.
If one player plays 16 games and scores 15 points in every game, his Spike Score is 0 because each of his scores minus the mean score is 0.
If another player scores 20 points in 8 games and 10 points in 8 games, his Spike Score will be [(20-15)/5] * 8 = 8. The games where he scored 10 are not included because they are below the mean.
Both players scored 240 points, but one player had a Spike Score of 8 while another had a Spike Score of 0.
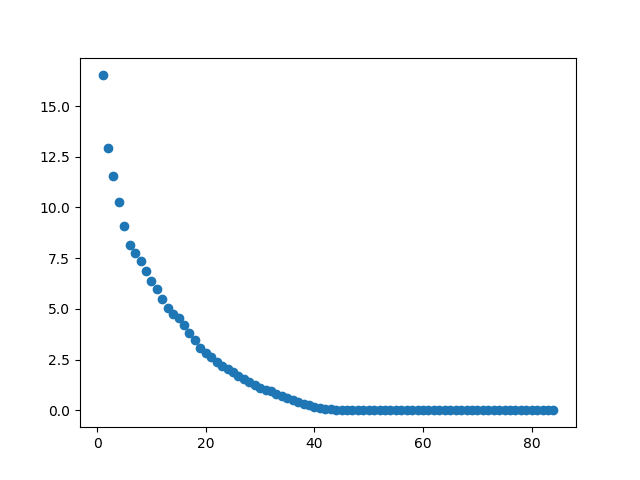
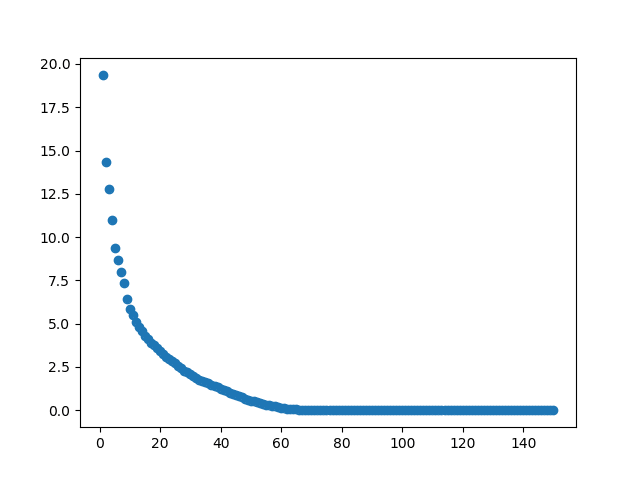
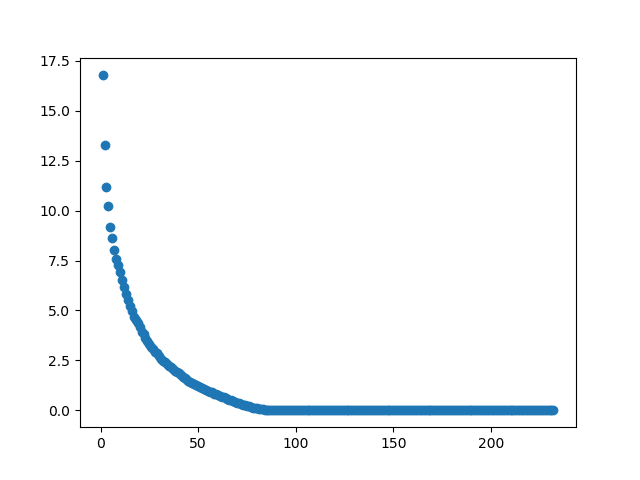
Here is a look at historic Spike Scores. The charts below show the average Spike Score for the top players at each position down to the bottom players at each position from 2013-2023:
QBs:
RBs:
WRs:
TE:
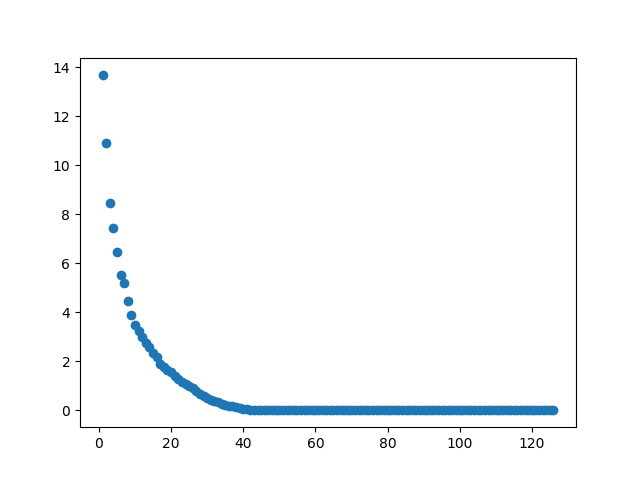
These charts look fairly similar to the draft capital charts and help provide an explanation on why draft capital has such a sharp drop off. For example, over the past 10 years, the RB1 has averaged a Spike Score of around 20 while the RB2 drops to below 15 and eventually it gets to the point between around RB 15-30 that there is not much difference in Spike Score between them. Once you get past RB50, none of those players even had a Spike Score. The same type of curve is seen for all positions, but the QB position does have the least steep decline, which is to be expected since QB scoring in the middle of pack is very replaceable.
This means that if the market were completely efficient and knew the results of the season before it started, the difference between the players being drafted very early to even a few rounds later is enormous. But, the market is not efficient and we do not know the results of the season.
How I want to take advantage of this information is by identifying players that do not go in the early rounds but that I think have an opportunity to have a high Spike Score. A perfect example was in 2023 when there were legitimate upside tight ends like Sam LaPorta and Trey McBride going in parts of the draft where draft capital does not historically matter. Sam LaPorta ended up having the top Spike Socrr in Underdog scoring. According to TournamentDB, 63% of LaPorta drafters drafted three tight ends, and another 5% added on a fourth.
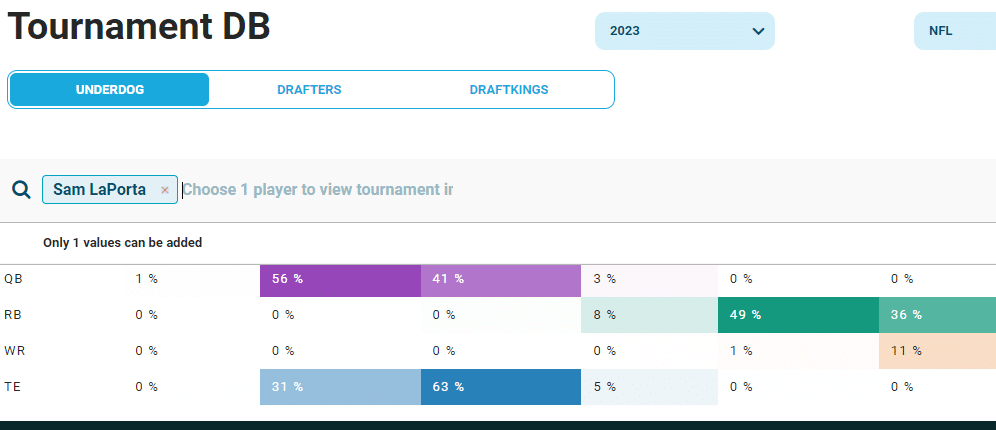
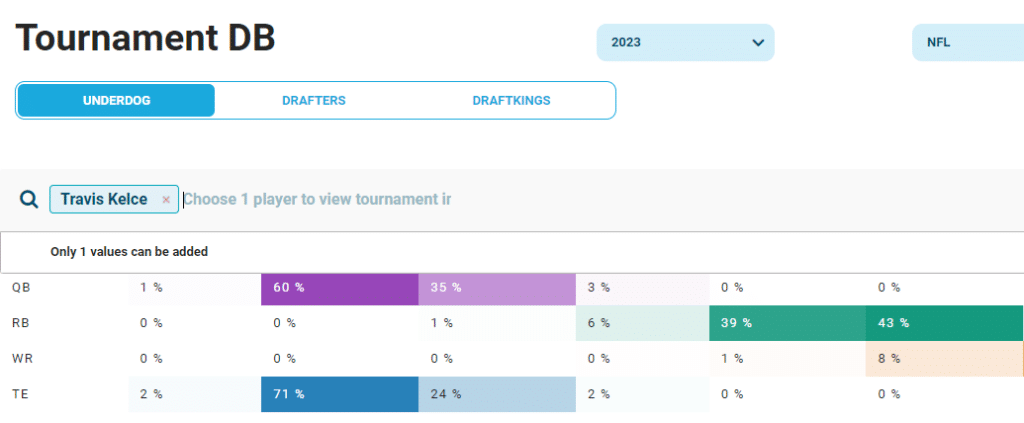
If you are able to identify a player that has the ability to do what Sam LaPorta did, you can gain a huge advantage on the field if you just treat him as the TE1 and draft your teams as if you have Travis Kelce on it, which 71% of drafters took only 2 TE, and even 2% took 1 TE:
Here’s the thing, we don’t know who is going to have the highest Spike Scores before the season starts, but Best Ball is a skill game that requires that we make bets. If you are willing to build your portfolio in a way that takes on some risk, ask yourself who you think the players are at each position that could have a huge Spike Score but are not early round picks, and draft them as if you just got a huge discount on draft capital at the position.
An interesting historical note. Here are the top 20 Spike Scores from 2013-2023 sorted by Underdog scoring:
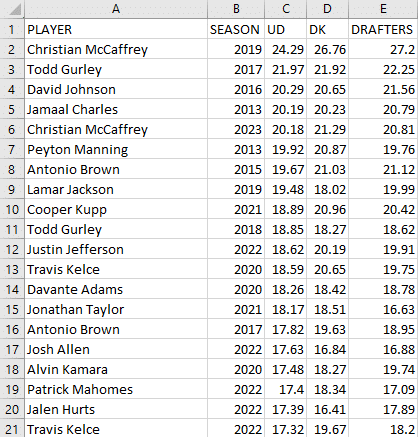
Notice that some of the best seasons, what Pat Kerrane calls a legendary season, come from the running back position. Also, 2013 Peyton Manning was a huge outlier as a pocket passer, and that is going to hard to match from a non-Mahomes pocket passer as long as guy like Josh Allen are in their prime.
One more thing, three of the best QB seasons in the last 10 years all occurred in 2022. That was the year that Pat Kerrane won BBM III, and it was also the year that one of those QBs missed the final two weeks and another of those QBs had his week 17 game cancelled. I’m not taking anything away from the winner, but I wonder how much our research is skewed by the fact that neither Hurts nor Allen played in week 17 that year.
Some observations from looking at spike scores for the 2023 NFL season:
Wide Receivers:
Justin Jefferson had a huge Spike Score given his reduced total point output, and Ja’marr Chase was pretty close behind. Both players are going very early in drafts, and both could still be the WR1 any season.
Keenan Allen was not just an accumulator. His Spike Score was monstrous.
Garrett Wilson had an anemic Spike Score, so here’s hoping Aaron Rodgers saves the day.
Chris Olave performed very poorly in the metric.
Running Backs:
We already mentioned De’Von Achane, but he was so good in the metric, that I’ll throw him in again.
James Conner just scores fantasy points, and he does so in ways that helped you win in 2023.
Khalil Herbert and D’onta Foreman stand out as guys that didn’t score a ton of raw points but did so in ways that helped. Ty Chandler also made the most of his opportunity.
Quarterbacks:
Justin Herbert, even with all of his receiver injuries, performed really well. However, he loses Keenan Allen who was a huge Spike player. Even Mike Williams and Austin Ekeler before their injuries were big time Spike Score players.
Brock Purdy still appears to be underrated based on how he performs in Spike Score. If the 49ers offense passes more this year, Purdy is likely to be around the top 5 at the position in Spike Score.
Tight Ends:
Mark Andrews was on his way to another elite season before his injury, and Isaiah Likely came pretty close to matching him when he was out.
A couple of cheaper tight ends that stand out were Juwan Johnson and Pat Freiermuth. Juwan injured his foot in June of 2024, so that’s important context to consider, but Muth is a guy that has a ton of targets opened on his offense and is someone that could provide similar results to a bully tight end room when paired with one the top guys without the price of an elite TE.


