What’s up, Spike Week fam? I love baseball. I played many innings of baseball growing up and it holds a fond memory in my heart. Which makes drafting MLB bestball is one of my favorites. Unlike traditional fantasy baseball, which can be a grind with constant roster management, best ball offers a “draft and forget” format. It’s ideal for those of us who want the thrill of building a roster without babysitting it daily.
Last year I had an awesome MLB season, with 19 of my 60 Dinger entries advancing to the playoffs. But the playoffs didn’t pan out, with only five semifinal teams, zero in the finals, and therefore, no big payday. This year, I’m determined to change that. In the below article I break down the plus EV strategies from prior year tournaments that I will be using to hopefully win money this year. Let’s get into it!
Side note, my wife and I recently adopted a puppy, Fiona. She’s amazing, and I’m obsessed. Stick around until the end of this article for a few adorable photos of her.
Tournament Basics
In the The Dinger tournament, your roster consists of 20 players. Each week, you need to field 3 Pitchers, 3 Infielders, 3 Outfielders, and 1 Flex Hitter with all other scores being unused. Scoring for hitters are made up of singles, doubles, triples, home runs, walks, hit by pitches, RBIs, runs, and stolen bases and pitcher scoring are made up of wins, quality starts, strikeouts, innings pitched, and earned runs (negative).
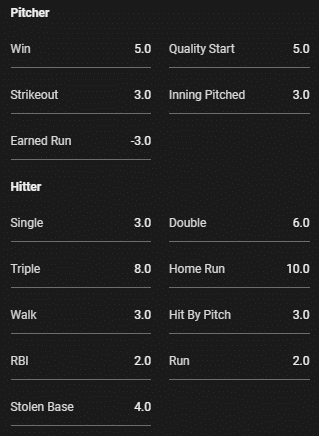
Scoring & Advance Rates Trends
To kick the data review off, let’s start by analyzing ADP versus best ball points scoring trends over the past three seasons. This will reveal how each position has scored and where tier breaks may have occurred.
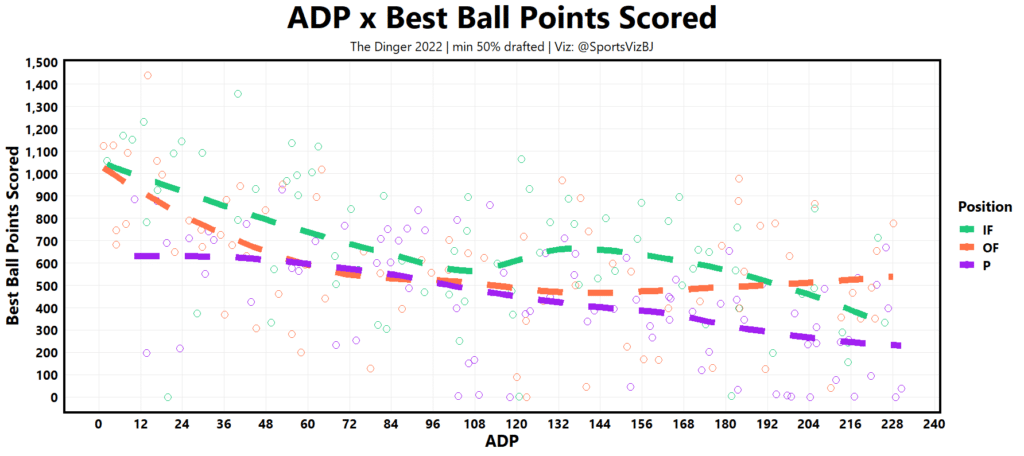
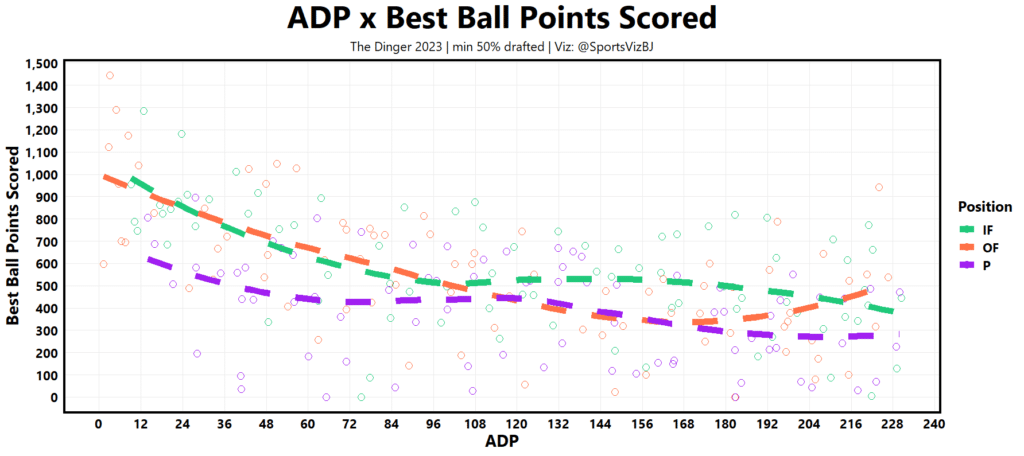
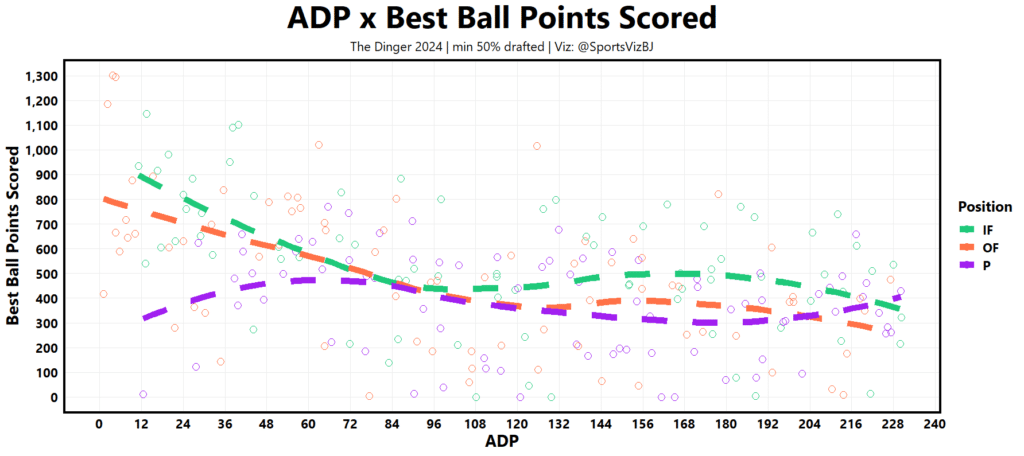
Analysis:
- Pitchers: Pitchers have the least diminishing return as we see the flattest curves in all three years. In 2024, the early pitchers were particularly bad, with Strider and Cole both missing significant time.
- Infielders: Infielder production at the top has been comparable to the top outfield scorers but the position has held its production really well as scoring has not dropped off in the later rounds.
- Outfielders: The outfield position has been strong at the top but scoring production has fallen off steadily throughout the draft. Unlike pitcher and infield, the outfield position has been very thin in the later parts of the draft.
Next, I plotted advance rate trends by draft position to help understand where the optimal pockets to draft each position have been for each of the last three years.
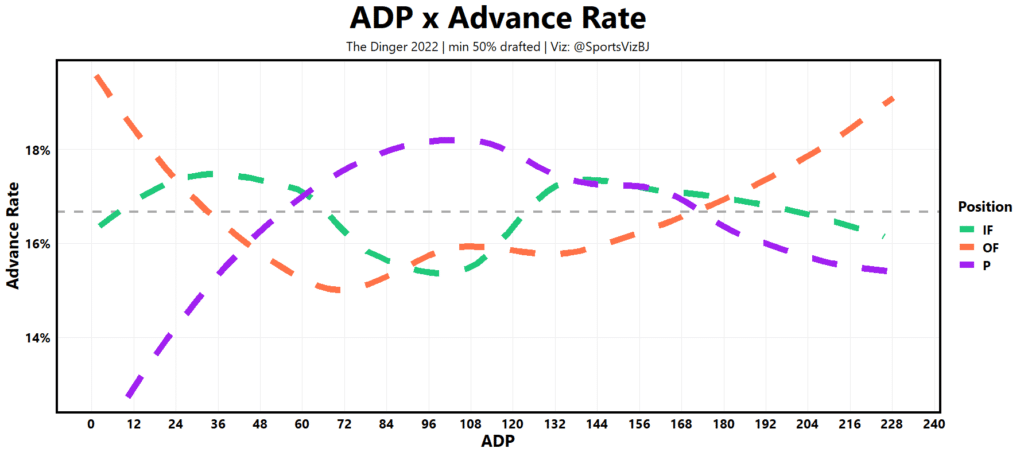
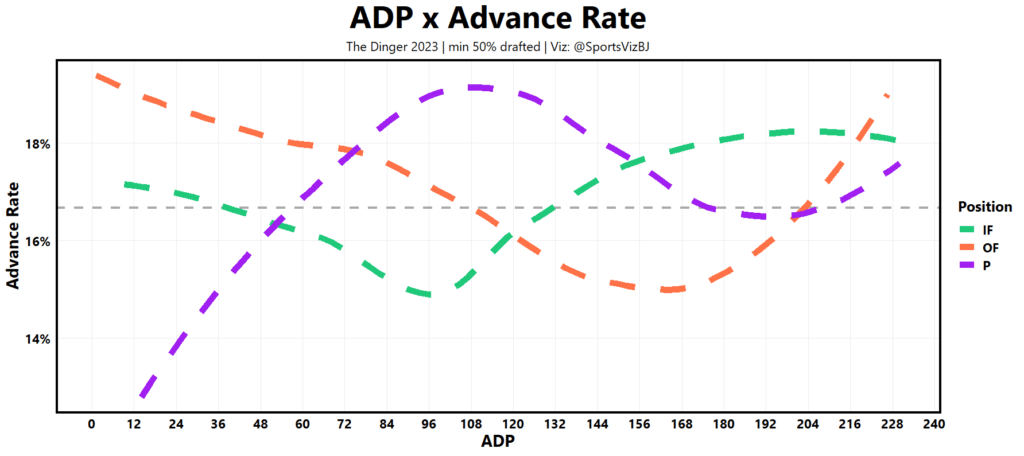
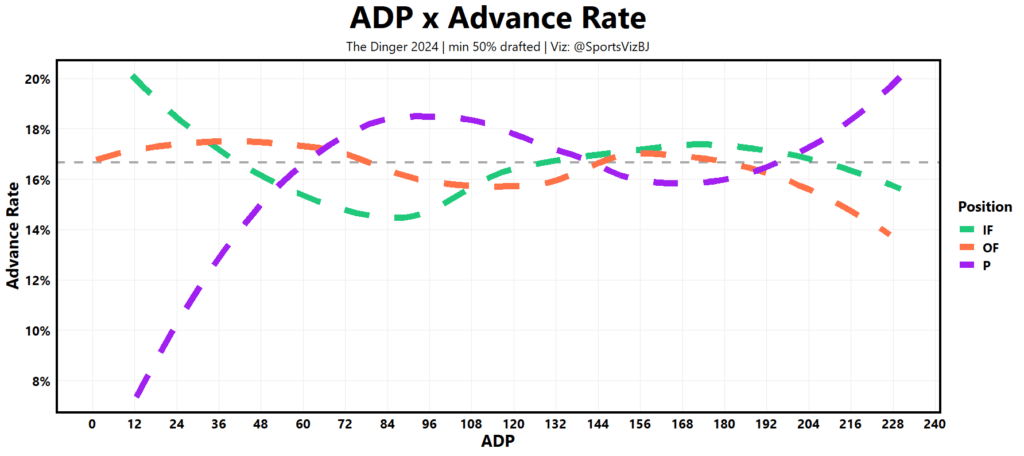
Analysis:
- Pitchers: Middle-round pitchers have been the sweet spot. Early picks have underwhelmed, while late-round dart throws have proven a good place to target as well.
- Infielders: The infield advance rate shape is the opposite of pitcher as the middle rounds have been the worst advance rates. This aligns with the points scored plots above as infielder scoring in this range is nominally better than multiple rounds later.
- Outfielders: The least consistent shape of the three positions, the one shape trend that has persisted in each season has been the success of early round outfielders.
To wrap up this intro section I plotted player level advance rate to put context to the summary visuals that are presented throughout this writeup.
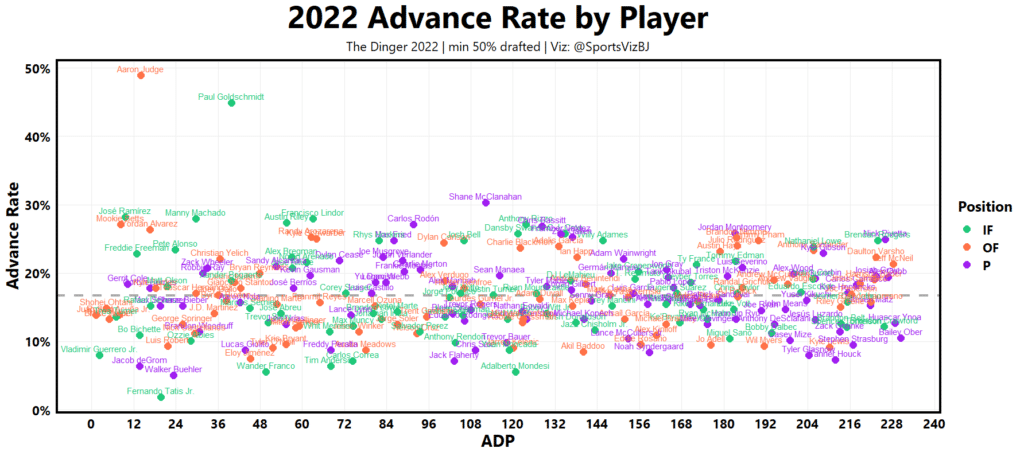
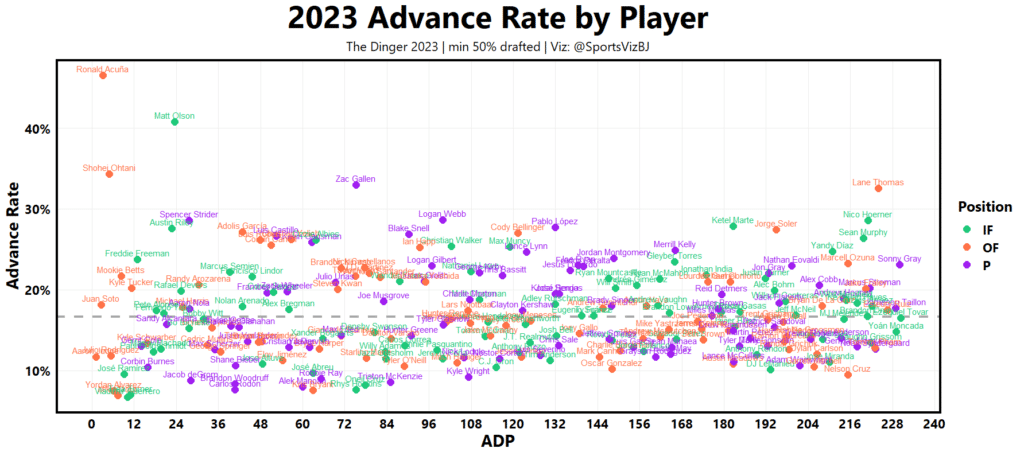
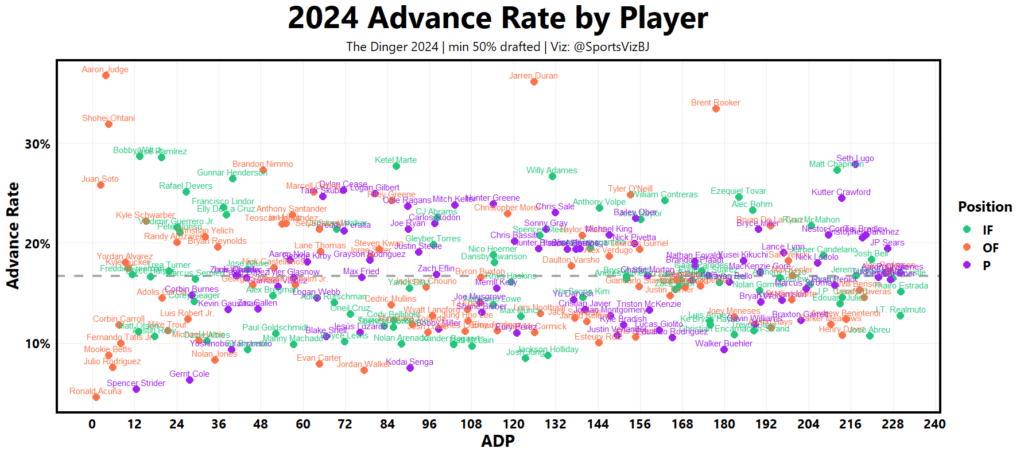
Analysis: If you are sharp with your player takes then there are major successes to be had at all points in the draft. But these plots also tell me one is likely to run into some significant over and under performers on most teams. Just as in real baseball, failure should be expected on most teams and therefore thin strategies should be avoided.
Team Build Performance
Reviewing how people have been building their teams and what has been working is the next step in the process. Here, we identify basic guidelines to keep our teams on track.
 Common Builds: The field was highly concentrated around six and seven outfield builds. The field has increased this concentration in each season.
Optimal Strategy: The best advance rates were six and seven outfield builds, with advance rates between 17% and 18%. Drafters which built the less frequently used outfield builds struggled to succeed.

Common Builds: Just like outfield, the field was highly concentrated around six and seven infield builds.
Optimal Strategy: The six infield build has been a plus advance rate strategy in each of the last three seasons but the optimal strategy in the last two seasons has been seven infielders. Eight infielder builds have also been in play historically, but was not the move last season.

Common Builds: The field’s most popular draft build has been seven pitchers in each of the last three seasons, increasing in usage each season. In 2022, the second most popular build was eight pitchers. In 2023 and 2024, the second most popular build was six pitchers.
Optimal Strategy: Seven pitcher builds has been the dominant strategy with the best advance rates in each of the last three seasons. Both six and eight pitcher builds show some life with positive advance rate seasons sprinkled in.
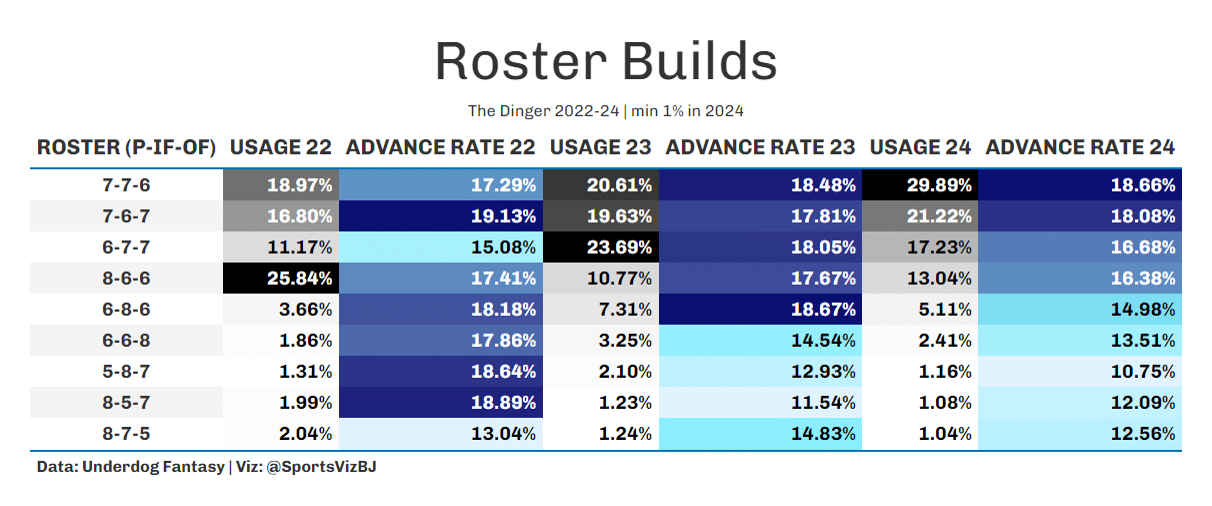 Summary of Roster Builds: Combine all the above and the most common builds have been 6-7-7, 7-7-6, 7-6-7, and 8-6-6. Of this group, the 7-7-6 and 7-6-7 have performed above base advance rates year over year while 6-7-7 and 8-6-6 have been less consistent but also high performing. In general the core builds have been the way to success while the fringe strategies have been thin bets.
Early Round Build Performance
The problem with summary data is it’s muddied with people who took different paths to drafting. Some six pitcher teams drafted all their arms early while others prioritized other positions with those picks. Not all builds are made equal, how you get there matters. Additionally, if a majority of the field is concentrated around the base builds, we must look for a new angle to attack. This section will look at how teams built their position rooms in the key rounds of the draft (first 5 rounds) and the effectiveness of those starts.

Common Builds: The field has been heavily used one pitcher starts in each season. Two pitcher starts has also been popular and zero pitcher starts has been in and out of style.
Optimal Strategy: There is a quite clear direction in which builds have been the best advance rates. Overinvesting in pitchers early often has led to disaster. Zero pitcher builds have dominated followed distantly by one pitcher builds followed distantly by two pitcher builds and so on.

Common Builds: The most common infield starting builds for the field has been one or two infielders. In each season, over 70% of teams have drafted one or two infielders.
Optimal Strategy: Two, three, and even four infielder builds dominated followed by one and zero infielder builds. Teams with adequate infield fire power have been proven to be winners.

Common Builds: The field’s most popular outfield start has been two outfielders. What has been second most popular has been shifting around between one and three over the years.
Optimal Strategy: Another clear direction in which builds have the best advance rates. The more outfielders drafted early the better teams have done. Two, three, and even four outfielder builds dominated followed distantly by one and zero outfielder builds.
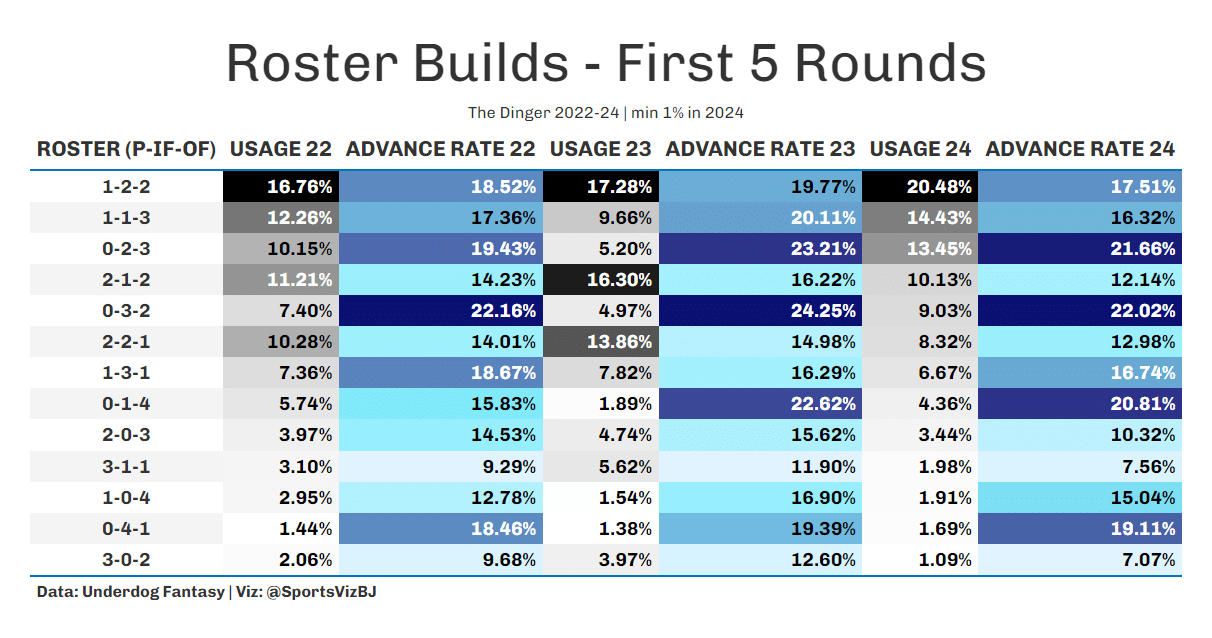
Summary of Early Roster Builds: Combine all the above and the most common build is 1-2-2. This structure has been consistently solid year over year with a plus advance rate in all three seasons. The standout data points are zero pitcher structures. 0-2-3, 0-3-2, 0-1-4, and 0-4-1 absolutely crushed in each season, with 0-3-2 being the most dominant of the builds. Even with an ADP market moving in the direction of zero pitcher drafting the strategy continued to dominate in 2024. The overarching message is that having hitter fire power has been requisite to success in this format. No matter how the pitcher market evolves, a “bully pitcher” strategy is one I will be passing on.
Anatomy of a Hitter Spike Week
Baseball season long projections are quite incredible. There are multiple free highly reputable data backed projections available on FanGraphs. But one of the hardest parts of best ball is turning these incredibly sharp season long totals into best ball scoring for rankings. Purely taking per game or per at bat metrics misses the nuance of best ball. Dud and average weeks are tossed out and Spike Weeks/access to ceiling outcomes is paramount. I find the best way to understand the drivers of high end best ball outcomes is by the below correlation analysis. The below table presents the 2024 correlation coefficient for weekly scoring and Underdog points scored component then sliced by category (base scoring, spike, super spike, and mega spike).

Highly Correlated to Spike Weeks: Runs, RBIs, and home runs are essential for spike weeks. Their importance increases when targeting super and mega spikes.
Minimally Correlated to Spike Weeks: Stolen bases and games played inflate the base projection but do little to drive high end outcomes. Treat them as a bonus rather than a priority.
Conclusion
I hope these data-driven insights give you a competitive edge in The Dinger. The edges in MLB best ball are real, and with the right strategy, you can set yourself up for success. Keep an eye out for more content soon, including this upcoming season of The Stacking Dingers Podcast which I will be co-hosting!
Oh, and as promised—here are some photos of Fiona, the reason you haven’t seen me in many draft rooms recently.


